Low-Key Hillclimbs: some Montebello statistics
Low-Key Hillclimbs week 1 is done, and it's the first time Montebello was coordinated by someone other than Kevin Winterfield or me. Huge thanks to James Porter for taking the controls while I'm away from home and getting the series off to a successful start! We had an issue with water: surprisingly, 450 ml/rider wasn't enough at the end of a climb for which the median climbing time is well under 1 hour. But otherwise the day wasa big win.
A big feature this year was the unusual (by historical standards) heat: the temperature was as high as 95F/35C for the day. This isn't especially hot, but it is by San Francisco Bay area standards, where the ocean breezes and the bay tend to maintain moderate temperatures year-round. Inland, at the central coast, things heat up.
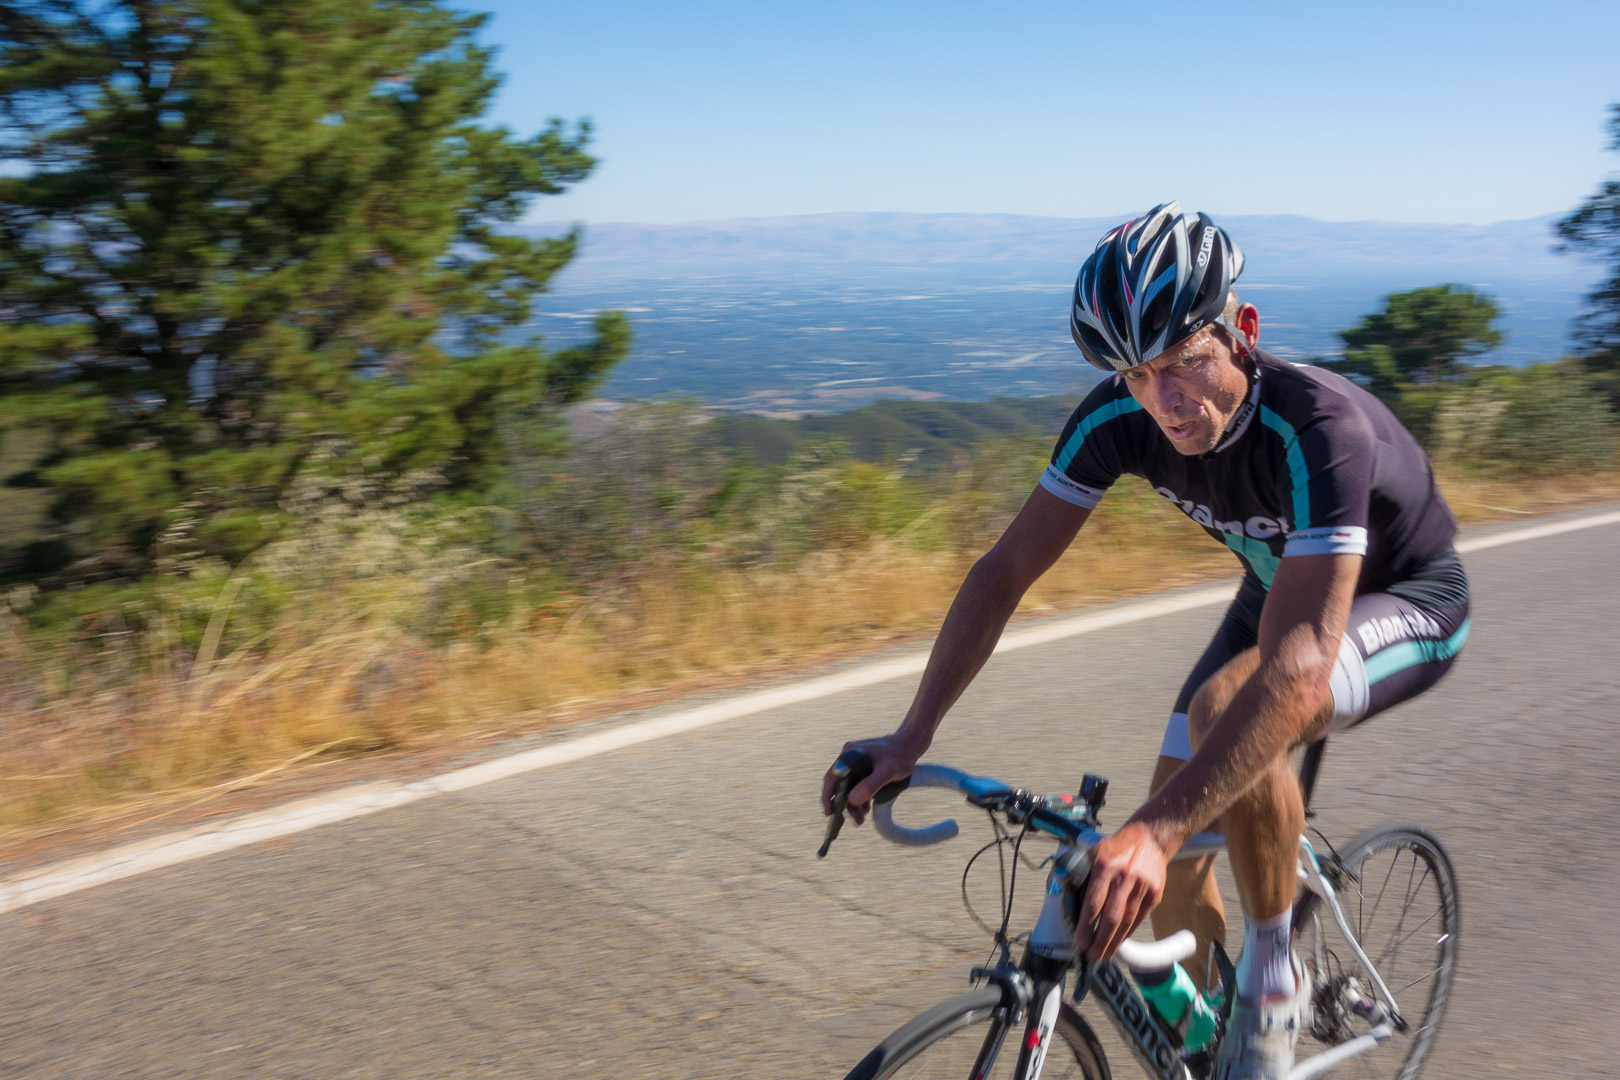
Bill Bushnell photo
With Low-Key Hillclimbs, week 1 is the anchor. It's almost always Montebello Road (1998 excepted), and thus provides a certain standard for comparison for year-to-year. Riders like to use week 1 as a gauge of this year's fitness versus previous years.
Given the heat, I was surprised when records were broken in the men's division, women's division, and with a all-time-2nd-best in the mixed tandem and hybrid-electric divisions. It was clear that for those able to stand the heat, there was no problem producing a smoking-fast time.
But did this apply to the population as a whole? For that I needed to look a bit deeper.
To compare times, I ranked climbs for all bikes with times over 23 minutes (excludes hybrid-electrics). I'm using bikes, not riders, so tandems count once. I combine men and women into a single statistical population. I then subtract 0.5 from the rank of the first bike (0.5 instead of 1), which puts his rank at the center of his "bin", and then add 1 for each subsequent bike (so ranks go 0.5, 1.5, 2.5, ...). Then I divide by the number of results: this maps ranks from 0 to 1, exclusive.
I plot time in minutes versus this normalized rank by year since 2008 in the following plot. 2008 was when the series numbers really started to pick up after it started again in 2006, following a long layoff (since 1998).
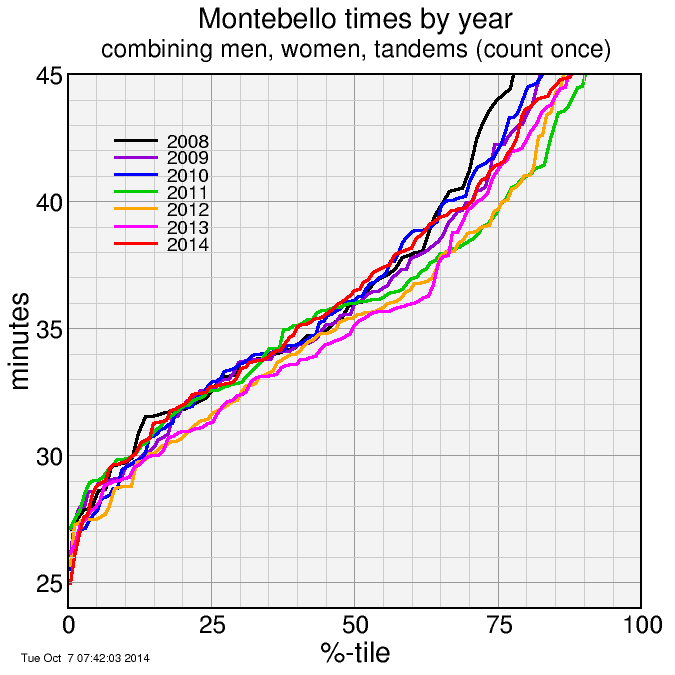
The plot is rather busy, but a few interesting features can be seen. One is the line for 2014 (red) trends ont he long side of the distribution. In contrast, last year (2013, magenta) is at the fast edge of the distribution, with 2012 not far behind. Another thing which makes itself evident from this plot is the first three years in the plot, 2008-2010, were a bit slower at the long-end of the distribution. This suggests since these three years the more endurance-oriented riders have tended to come out less than the faster riders.
To quantify this I took quartiles: the 25%-tile, the 50%-tile, and the 75%-tile of the distributions. The 25%-tile is the time at which 25% of the riders are faster, 75% slower. The 50%-tile is where an equal number of riders are faster and slower. The 75%-tile is where 75% are faster, 25% are slower. These times are interpolated from the actual distribution, which typically may not have times at these points exactly. So for example, if there's 120 riders, the 50%-tile is the average of positions 60 and 61.
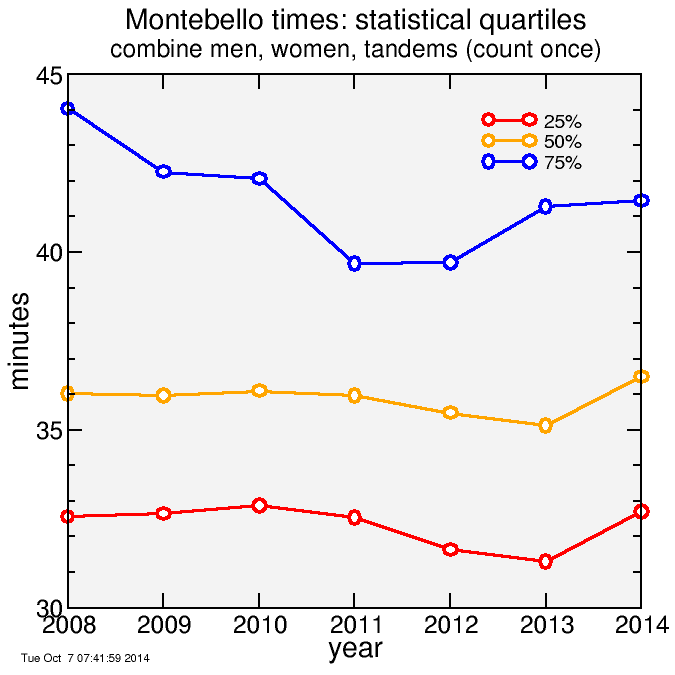
The results here confirm what I described before. Times at the top end (25%, 50%) were fairly flat from 2008 through 2011. They improved each of the following two years, but this year were slower. It's clear a large number of riders may have been affected by the heat. But in contrast, the 75%-tile was on a downward slope from 2008-2011. Since 2011 it's been fairly flat. The heat had less of an affect on the 75%-tile this year. This doesn't mean riders in this segment aren't affected by the heat; it's also possible that they were more likely deterred by the weather. There's many explanations.
So hats off to the top performing riders: top male Nick Bax, top female Beth Reid, 2nd woman McLovely Brown (who broke her existing Strava QOM), tandem team Emma and Jonathan Dixon, and hybrid-electric Bill Bushnell. They clearly were well-prepared for the conditions.
And for everyone else: hats off to you, as well! Overcoming the heat to make it to the top of Montebello Road, a challenging climb by any reasonable standard, is a worthy accomplishment.


Comments